The service desk metrics worth tracking are first response time, time to resolve, first contact resolution, SLA compliance, ticket volume and backlog, and customer satisfaction. Cost per ticket joins them once you have a few months of data. Track a small set, define each one clearly, and read them together, because no single figure tells you whether your IT support is working.
This guide is for business owners and IT managers who want to judge their IT support, whether it is run in-house or by a provider. It covers what each metric means, how it is calculated, which targets other UK organisations publish, and how to avoid numbers that look healthy while users stay frustrated.
Which service desk metrics matter most
Service desk metrics are measurable indicators of how well your support team handles requests and incidents. Used properly, they show where support is strong, where it is slipping and where your money is going.
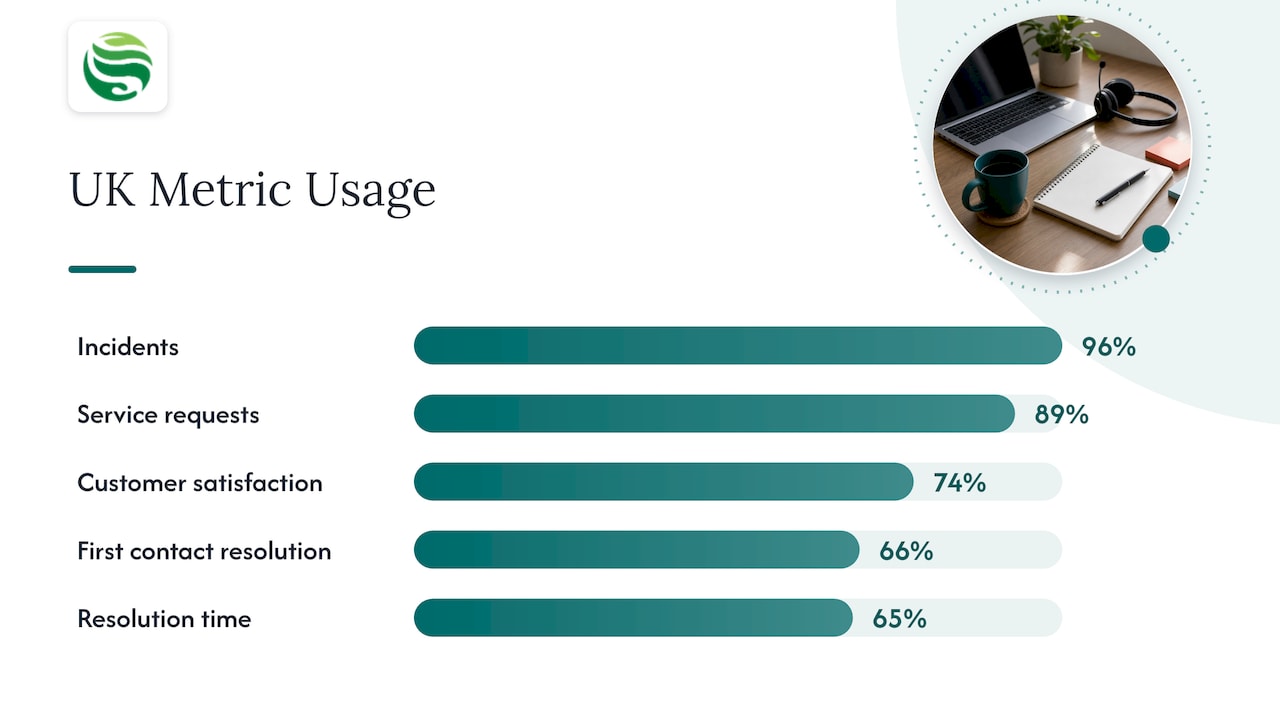
The Service Desk Institute (SDI) has surveyed which measures UK desks actually use. In its 2018 report, as summarised by Ivanti, the most common were number of incidents (96%), number of service requests (89%), customer satisfaction (74%), first contact resolution (66%) and average incident resolution time (65%). Average incident response time (59%) and abandon rate (55%) followed.
For a small or medium-sized business, a practical starting set looks like this:
| Metric | What it tells you | Read it alongside |
|---|---|---|
| First response time | How quickly a person acknowledges the problem | Resolution time |
| Time to resolve | How long users are without a working service | Reopened tickets |
| First contact resolution (FCR) | How often the first interaction fixes it | Customer satisfaction |
| SLA compliance | Whether agreed targets are being met | User feedback |
| Ticket volume and backlog | Demand and whether work is piling up | Staff or hours available |
| Customer satisfaction (CSAT) | How users feel about the outcome | FCR and resolution time |
| Cost per ticket | Efficiency of the service | CSAT |
If you only have time for three, start with first response time, time to resolve and CSAT. Between them they cover speed, completion and experience.
How the main service desk metrics are calculated
A metric is only useful if everyone calculates it the same way. Write down each definition before you start reporting.
- First response time: the time from ticket submission to a reply from a human agent. Zendesk’s guide to ITSM metrics points out that an automatic acknowledgement does not count, and that a quick first reply reassures staff even when the full fix takes longer.
- Time to resolve: the time from submission to confirmed resolution. Decide whether the clock stops while you wait for the user to reply, and apply that rule consistently.
- First contact resolution: tickets resolved at the first interaction, divided by total tickets.
- SLA compliance: the ITIL Performance Benchmarking Model defines on-time incident resolution as incidents resolved within the times set in your SLAs or agreed process, divided by the total number of incidents. It recommends using a month of normal business activity, or averaging two to three consecutive periods, so one unusual month does not distort the picture.
- Backlog: the number of tickets still open at a given point. Track it as a trend, not a single snapshot.
- Cost per ticket: according to HDI, this is the total monthly operating cost of the service desk divided by monthly ticket volume.
A useful habit: compare like with like. Measure incidents (something is broken) separately from service requests (someone wants something, such as a new account), because their expected resolution times differ widely.
First response time and resolution targets by priority
A single response target for every ticket is a common mistake. A server outage and a request for a new mouse should not share a clock.
The GOV.UK Service Manual advises basing response times on historical data for each channel, then expressing service levels as the percentage of enquiries you aim to solve in a given period. Its example is answering 80% of email enquiries within 24 hours. That wording is worth copying: a percentage target is more honest than “we always respond in an hour”.
Published UK examples give you a sense of scale:
| Organisation | Published target |
|---|---|
| Imperial College London ICT | First response in 1 hour (P1), 2 hours (P2), 4 hours (P3), 8 hours (P4); resolution in 1, 2, 5 and 10 days respectively, measured 09:00 to 17:00 |
| University of Leeds IT Service Desk | 70% of calls resolved at first level, 90% answered within 2 minutes 30 seconds, emails answered within four hours |
These are large university services with their own staffing and hours, so treat them as reference points, not promises you must match. Note that Imperial measures within standard working hours. If your business relies on systems in the evenings or at weekends, your targets need to state whether out of hours cover applies, otherwise the numbers will not reflect what your staff experience.
Setting priorities that people understand
Keep the priority scheme simple: usually four levels, based on business impact and number of users affected, not on who shouts loudest. Agree them with your team in plain language, for example “whole office offline” versus “one user cannot print”. A clear escalation management process also helps, because response targets mean little if nobody knows who takes over when a ticket is at risk of breaching.
Reading ticket volume, satisfaction and cost per ticket
The numbers only help when you interpret the movement, not the single figure.
Ticket volume. Rising volume is not automatically bad news. Look at volume per user and by category. If your headcount grows 20% and tickets grow 40%, each person is generating more contact, which points to a recurring cause such as onboarding gaps or a failing application, a pattern KPI Tree describes. Fixing the cause beats adding hours.
Customer satisfaction. A short survey sent when a ticket closes is enough. Review low scores individually; they usually reveal a process fault that averages hide.
Cost per ticket. HDI notes that a higher than average cost per ticket is not necessarily bad if satisfaction and service levels are also higher than average. Metabase adds two cautions: a monthly spike is often just fixed costs spread over a quiet queue, and pushing cost down without a quality check can quietly raise reopened tickets as agents close tickets too aggressively.
Improvement is achievable when desks measure consistently. The SDI’s case study reports that Domino’s cut cost per ticket from £68 to £5 and incident resolution time from 12 hours to 4 after joining its certification programme. That is one large organisation’s result, not a benchmark for a small business, but it shows what disciplined measurement can lead to.
Choosing service desk metrics without the watermelon effect
More metrics do not mean better insight. Pink Elephant warns that tracking too many KPIs can overwhelm a team and cloud the picture, and that focusing on efficiency alone can neglect user satisfaction and business outcomes.
The SDI’s Naked Service Desk Metrics guide suggests a sensible order of work:
- Decide what kind of service you want to provide and what your users consider important.
- Set four or five critical success factors that reflect your business goals.
- Create a KPI for each factor, then report against targets with red, amber, green status.
The same guide describes the “watermelon effect”: a metric that is green on the surface while the experience underneath is red. A desk can hit its first response target with a one-line reply and still leave users waiting days. Pair every speed measure with an outcome measure (CSAT, reopen rate), and the SDI’s Global Best Practice Standard makes the same point: it calls for a balanced set of metrics tied to business outcomes, not individual figures in isolation.
For security, add a view of how quickly incidents are escalated and closed. Our guide to IT change management and its KPIs covers the measures that sit next to support performance.
How we support businesses in Aberdeen and Aberdeenshire
At Abersecure we provide IT help desk support alongside managed security for small and medium-sized businesses, built around our Security by Default approach. If you want clear ownership of your technology without building an in-house team, our managed IT support is designed for that. If you need help only occasionally, pay as you go IT support is the flexible route. Whichever you use, the measures above are the ones to judge any support arrangement by. Our guide on how to choose IT support explains the wider decision.
Frequently asked questions
What are the most important IT helpdesk metrics for a small business?
Start with first response time, time to resolve and customer satisfaction. Add first contact resolution and SLA compliance once you have a clear priority scheme. Keep the set to four or five measures so that the team can act on what the figures show.
What is a good first response time benchmark?
It depends on priority and channel. Imperial College London publishes targets from 1 hour for its most urgent incidents to 8 hours for the lowest priority, during working hours. The GOV.UK Service Manual suggests setting percentage targets for each channel from your own historical data, so begin by measuring your current performance.
How often should we review service desk metrics?
Review them monthly, as HDI recommends for cost per ticket, and compare trends rather than single months. Use a normal month as your baseline, or average two to three periods, as the ITIL benchmarking guidance suggests.
Can service desk metrics be misleading?
Yes. A metric can meet its target while users remain unhappy, which the SDI calls the watermelon effect. Reading speed, quality and satisfaction measures together keeps the picture honest.